Key Highlights:
  • Brain mapping is the study of understanding the structure and function of the brain.
  • Techniques to map the brain have existed for over 100 years, yet a comprehensive understanding continues to elude academics and clinicians.
  • Now, with connectomics and machine-learning, we are uniquely positioned to better understand the complexities of each individual’s unique brain.
brain maps transparent


Much like the cartographers who mapped the intricacies of the world’s coastlines, Neuroscientists have long been working to map the human cortex into distinct neurobiological subregions.


While historically this has been a difficult field to apply technically, consistently, and practically, today with advances in medical imaging and data processing, both academics and physicians are increasingly incorporating such maps into their examination of the brain.

Charting cortical maps

To further understand the role different parts of the brain play in the concert of human existence, the field of brain mapping and atlas-based approaches emerged. These involve the brain being segregated into predefined regions and studied as individual volumes in a process called ‘parcellation’.

The appeal of modern brain mapping is its specificity, offering a way to define small areas of cortex which can be standardized between researchers and physicians alike. Driving the development of more accurate, usable atlases forward is the notion that if everyone investigating the brain were to make use of a common atlas and regional naming system, any confusion in the interpretation of related findings would be minimized - bridging the gap between academic research and clinical applicability.

Whilst Atlases can be utilised to study isolated brain regions, several regions can also be studied together based on prior knowledge of how they facilitate function as part of a larger network. In 2011, Yeo and colleagues proposed that seven networks comprised the human cortex: the sensorimotor, visual, limbic, central-executive, default-mode, salience and dorsal-attention networks1. Whilst these major networks are largely consistent across neuroscience, there now exist numerous methods to map the individual regions which constitute them. This article presents the most prominent and well-recognised human brain atlases and how modern technologies and techniques have rapidly expanded these methods, making brain mapping increasingly accurate and clinically relevant.

Central Executive Network

The central executive network (CEN) and subregion, the medial component of temporal area 1 (TE1m).

From the ground up: cytoarchitecture of the brain

Before modern imaging techniques were invented, the only methods available to map the human brain was through direct tissue investigation - by its appearance, composition of nuclei, lamination and thickness.

In 1909, German anatomist Korbinian Brodmann published the world's first human brain atlas, positing that 52 functional regions made up the human cortex, and that these could be defined by their cytoarchitectural organization2. In 1925 a refined -yet largely similar- version of Brodmann’s Atlas was published by Constantin von Ecomo and George Koskinas3. Despite its relative simplicity for complete cortical organization, Brodmann’s Atlas remains well-respected throughout Neuroscience. Additionally, a number of the regions he defined, such as the primary motor and somatosensory cortices and subregions of the cingulate gyrus have been well conserved throughout subsequent atlases derived from his original definition4,5.


Cytoarchitecture of the brain

Broadmann's original 52 region Cytoarchitectural atlas.

Big data approaches: the human connectome project (HCP) atlas

With the advent of Magnetic Resonance Imaging (MRI), our ability to refine our understanding of the human brain increased exponentially, and researchers were able to build upon the work of the early century by measuring where activity in the brain altered during specific tasks or at rest.

In 2016, a landmark publication by Glasser and colleagues unveiled the “Human Connectome Project” (HCP) atlas - an analysis based not solely on the physical architecture of the brain, but rather a combination of its topology and function - the first multi-modal atlas of the human brain6.  A further benefit of MRI was that it allowed for brain structure to be investigated in vivo. That is, there was no requirement for physical tissue and as such this allowed the HCP to validate their atlas over a group of more than 1000 subjects. The complete HCP atlas proposes that there exists 360 independent regions of the cortex, 180 in each hemisphere, which can be individually mapped, named and functionally-defined.


The Human Connectome Project Atlas

The Human Connectome Project (HCP) 360 region multimodal atlas.

Areas that wire together fire together: modern connectivity-based atlassing

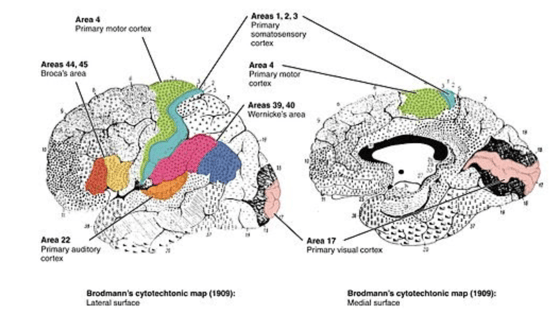
Although significant improvements have been made in the field of brain mapping since the original work of Brodmann, van Ecomo and Koskinas, a glaring conceptual issue with utilizing atlas-based approaches remained to be solved. That is, how could a universal atlas be applied to individuals where the cortex is physically distorted?

Whilst most image processing pipelines are able to account for abnormalities such as large intracranial volumes, previous atlassing techniques could not account for when the cortex had been displaced due to the presence of a tumor or developmental disorder. The solution came from the insight that white matter tracts are largely preserved in almost all cases of anatomical distortions to the brain.


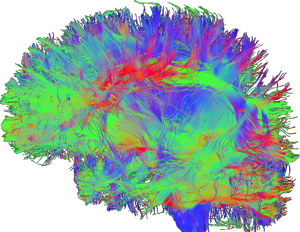
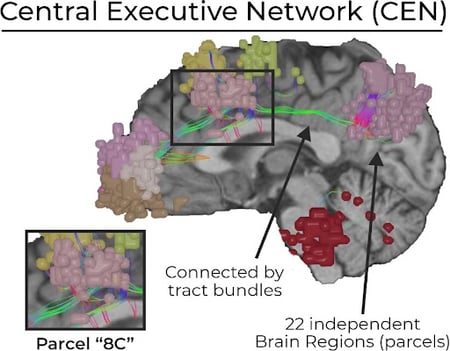
For example, the growth of a tumor may push surrounding gray matter in the direction of its mass effect, but it will very rarely sever any connection between two distinct gray matter regions. By utilizing diffusion weighted imagery (DWI) to map the white matter in anatomically distorted brains, a “structural connectivity profile” can be generated. By then comparing the start and end points of these white matter tracts against healthy brains, volumes of gray matter (in which white matter starts or ends) can be assigned their most likely brain region. The corollary of this process is that in the case where this tumor is surgically resected, the cavity left behind will correctly remain unassigned to any brain region - as the volume which it takes up will not contain any neural tissue whatsoever.

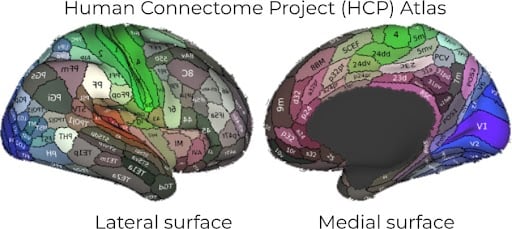
Consistent with the naming and distribution of the 360 parcels determined by the HCP atlas, Omniscient’s “Structural Connectivity Atlas” (SCA)7 includes an additional 19 subcortical regions for a total of 379 unique brain regions. It employs a fully automated machine-learning approach which constantly improves in accuracy and reliability as more data is acquired to train, test, and improve the model.

o8t Structural Connectivity Atlas (SCA)

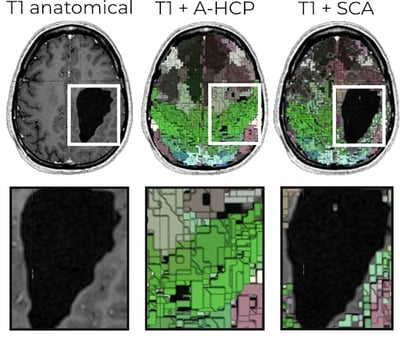
The o8t 379 region Structural Connectivity Atlas (SCA), demonstrating its sensitivity to necrotic tissue where a tumor once resided.

But why do we keep making new atlases?

Generally, atlas-based approaches serve the underlying purpose of providing clarity and certainty when discussing findings relating to brain structure and function. Importantly, the ‘certainty’ they provide is bounded by the specificity of the atlas in use, and as such new and exciting technologies will undoubtedly play a role in improving our understanding and ability to generate more accurate atlases of the brain. More information about how connectivity can compliment the study of brain mapping can be found in our recent article: “Brain network connectivity: the processes that make us human”, as well as complimentary pieces on Diffusion Weighted Imaging and the brain networks discussed in this article.

References

Expand for full list of references
  1. Yeo, B. T. T., Krienen, F. M., Sepulcre, J., Sabuncu, M. R., Lashkari, D., Hollinshead, M., Roffman, J. L., Smoller, J. W., Zöllei, L., Polimeni, J. R., Fischl, B., Liu, H., & Buckner, R. L. (2011). The organization of the human cerebral cortex estimated by intrinsic functional connectivity. Journal of Neurophysiology106(3), 1125. https://doi.org/10.1152/JN.00338.2011
  2. von Economo, C., & Koskinas, G. (1925). Atlas of Cytoarchitectonics of the Adult Human Cerebral Cortex. Originally published under the title “Die Cytoarchitektonik der Hirnrinde des Erwachsenen Menschen”. Textband und Atlas, Wien und Berlin.
  3. Brodmann, K. (2005). Brodmann’s: Localisation in the cerebral cortex. (L. J. Carey Trans.). Berlin: Springer.
  4. Annese, J. (2009). In Retrospect: Brodmann’s brain map. Nature 2009 461:7266 461, 884–884. doi:10.1038/461884a.

  5. Zilles, K., & Amunts, K. (2010). Centenary of Brodmann’s map — conception and fate.Nature Reviews Neuroscience 2010 11:2 11, 139–145. doi:10.1038/nrn2776.

  6. Glasser, M.F., Coalson, T.S., Robinson, E.C., Hacker, C.D., Harwell, J., Yacoub, E., et al.  (2016). A multi-modal parcellation of human cerebral cortex. Nature 536, 171-178.
  7. Doyen, S., Nicholas, P., Poologaindran, A., Crawford, L., Young, I. M., Romero-Garcia, R., & Sughrue, M. E. (2021). Connectivity-based parcellation of normal and anatomically distorted human cerebral cortex. Human Brain Mapping, 1– 12. https://doi.org/10.1002/hbm.25728